van Holde - Weischet Tutorial |
In some cases samples tend to aggregate by forming reversible or irreversible polymer units. Oftentimes, this aggregation is concentration dependent, and reversibility can be asserted by simply diluting the sample and running it again. Isodesmic associations cause sometimes indefinite self-associations, each successive multimer associating with a similar association constant as the previous step. Such cases will result in mixtures of different multimers in solution which may have very different sedimentation properties.
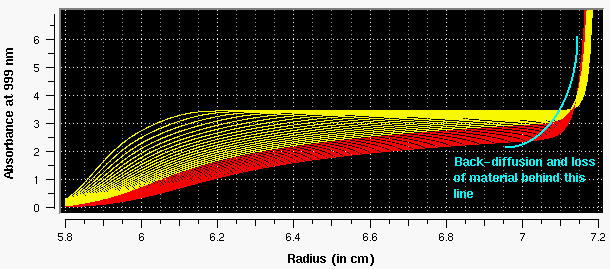
Such aggregation can easily be detected by running a sedimentation velocity experiment, since it will result in a characteristic van Holde - Weischet extrapolation plot, that shows both loss of material and great heterogeneity. Oftentimes, the slower sedimenting components are present in higher concentration. Shown below is a velocity experiment of a typical isodesmically self-associating system.

Figure 23: Isodesmically associating system. Scans drawn in red do not have a stable plateau and should not be included in the analysis. Due to the great range of S-values present, it is often difficult to select a speed that allows proper analysis of all components in the system at the same time.

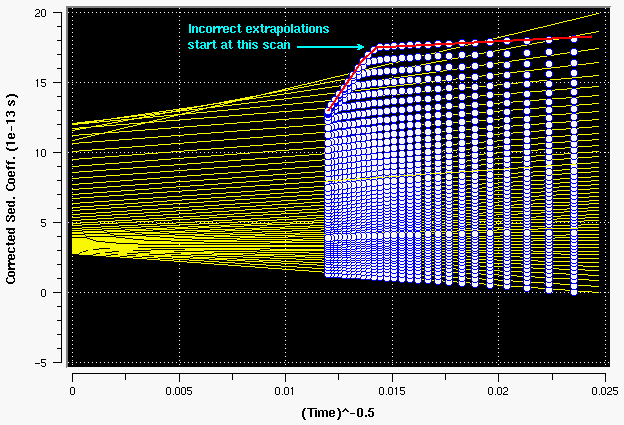
Figure 24:van Holde - Weischet analysis of data including scans drawn in red. The extrapolation plot clearly shows a diagnostic identifying the scans that should be excluded from the analysis. In addition, heterogeneity in S is clearly apparent. All scans which do not have a stable plateau display the loss of material in the upper boundary fractions and cause poor correlation in the linear fits. The extrapolation lines cross over similar to concentration dependent samples, however, after excluding inappropriate scans, the data reverts to nearly perfect correlation (see below).

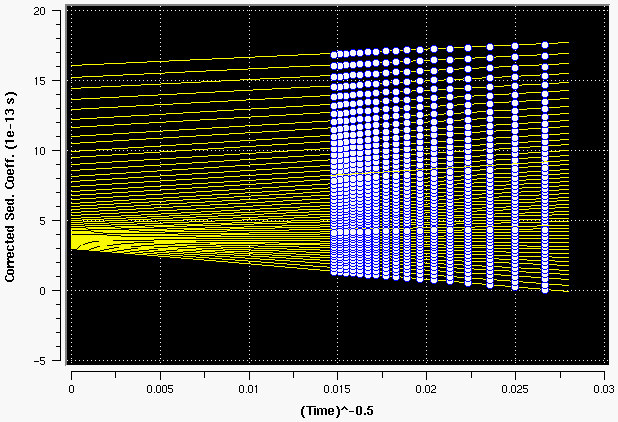
Figure 25: van Holde - Weischet analysis of data excluding scans drawn in red. The extrapolation plot shows a good correlation for all scans across the entire boundary and identifies a large range of S values in the sample.
 |
This document is part of the UltraScan Software Documentation distribution.
Copyright 1998, 1999, The University of Texas Health Science Center at San Antonio.
The latest version of this document can always be found at:
Last modified on June 12, 1999.